Seeing the Beauty in Data: Economics Dean Conducts SDRC Webinar Training on Statistics

 “For the results of a statistical test you have four possibilities…For a Type II error, you have a false negative. Parang na-test ka ng COVID.”
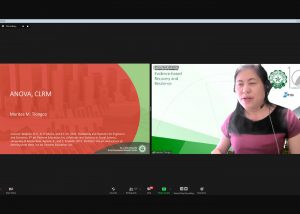
Making abstract concepts come alive through very familiar examples is a skill the Social Development Research Center regularly delivers to its audiences. This was once again evident in the Webinar Training on Statistics for the Social Sciences conducted on November 20 via Zoom, with DLSU School of Economics Dean Dr. Marites Tiongco sharing her expertise as its resource person. Participated in by 127 attendees, mostly from academe, NGOs and government agencies, the three-hour webinar lecture/demonstration examined the topics of probability, statistics and economics, which were demonstrated through the use of MS Excel.
Prior to reviewing basic statistical concepts for the benefit of participants, Dr. Tiongco gave a brief introduction to why she chose a career involving data analysis and what made it vital to researchers. First, she noted that “data is beautiful”—it is more exciting when one collects it oneself, and it also gives one a better grasp of the information than when dealing with secondary data. Second, “data is insightful and powerful”—one can “come up with a lot of stories” through analysis by identifying trends or comparing cases among groups in different categories. Her third point was a warning that “data can also be deceitful,” and that while many people recognize that data is powerful, it can also be mishandled. Thus, while “You can use the data to reinforce your belief in a very strong causal story,” it may not be trustworthy “even if you have the patterns you observe.” In other words, “correlation is not causality.”
Dr. Tiongco then proceeded to guide participants through a discussion of subjects and review of formulas, illustrating each by performing equations and pointing out their applications (It is “Common to use test statistics that follow a standard distribution”). Participants were also provided an analytic tool pack for use during the webinar workshop and on their own afterward. The concepts covered during the session included properties of sample mean, unbiased and efficient estimates, statistical hypotheses, statistical tests and results, p-value, t-statistic, unknown vs. known variance, tests for variance, and measures of central tendency and dispersion; ANOVA and linear regression—inference and confidence intervals: confidence interval for proportion and confidence levels, hypotheses and significance tests, Type I and Type II errors, categorical association – chi-squared test for goodness of fit, and comparing two independent groups.
Questions from participants that were addressed by Dr. Tiongco involved the implication of data results for a policy or programme in terms of mean and confidence interval, calculating for power or precision of one’s sample to ensure accurate research results, whether Excel is accepted in the academic community for use in a statistical tool pack, and whether it is advisable to use XLStat in high impact journals. Some participants expressed their interest in learning other Statistical software for their data analysis. Dr. Tiongco expressed her willingness to facilitate future webinars utilizing other statistics software such as R which is a free software, possibly in March or April.
Majority of the participants in the Webinar Training for Statistics in the Social Sciences represented the University of St. LaSalle-Bacolod, Camiguin Polytechnic State College, DLSU, Philippine Center for Postharvest Development and Mechanization (PHilMech), Mariano Marcos State University, Arellano University, St. Louis University, Bulacan State University, Ilocos Sur Community College, DLSU Intellectual Property Office-KANDILI, and the Department of Labor and Employment (DOLE).


